This lesson was inspired, in part, by frustration. Sometimes I paddle local rivers, and I always visit this United States Geological Survey (USGS) site beforehand to check water levels. The site has the information that I need, but the frustrating part is that there is too much information and it's poorly formatted. The site lists ALL of the rivers in Georgia and clearly was put together with little concern for the overall user experience. Essentially, it's just a big ugly spreadsheet. Every time I visit I wish there was something more user friendly that I could use to easily find the specific information that I need. But why whine when USGS provides all of the stream flow information for the entire country via APIs? In this lesson we are going to dig into those APIS and take control of our paddle planning experience.
- If you haven't visited already, take a look at the site we want to improve on. As you can see, the site is divided into rivers, with information from specific stations for each river. We will focus on the Oconee river and its tributaries, and figure out how to extract information for Gage Height and Discharge in cubic feet.
- We are about to take a look at one of those APIs, but before you do anything else,
- I recommend that you use the Chrome browser,
- visit the Chrome web store, and add an extension called the JSON viewer, or another simply named JSONview. Either of these extensions will format JSON feeds to make them as human friendly as possible.
- Now visit this link (WITH CHROME) which leads to a JSON feed for the Bostwick station of the Apalachee river just south of Athens. The Bostwick station has the best information for one of my favorite trips, from Price Mill Road to Highway 441. If the water level is below 2 feet, this trip is literally a drag. If it's near 3 feet or above, the same trip can be scary, plus some of the best features of this particular run will be submerged. As a result, it's a very good idea to check the levels before paddling.
- Before we examine the data itself, take a look at the URL which contains values that tell the API the site, specific information, and format (JSON) that we want it to deliver.

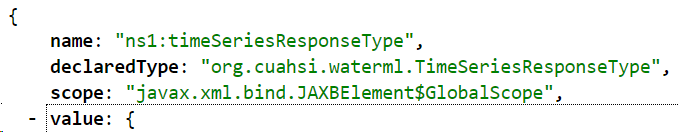
The site number pertains specifically to the Bostwick station. The two parameters we are requesting are discharge in cubic feet (00060) and gage height (00065), which are separated by a comma in the URL. Input a different site number, and you will see the same data for a different location. Change the parameters, assuming that additional parameters are available, and you will load a different set of information for each site. - Now look at the data. We really need just two tiny pieces of information but the path to reaching that information is quite convoluted (to say the least :). The overall site is encased by curly {} brackets, followed by name value pairs, which means that we are dealing with one BIG object, which in turn leads to smaller objects, arrays, and more objects and arrays inside of those objects and arrays. All of this just to get two numbers! The first 3 comma separated values, name, declaredType, and scope, lead to information that we don't need. The fourth value, named value, is the one that we need.
- The value named value, in turn leads to more objects and arrays. The first object inside of the value object is named queryInfo which has absolutely nothing that we need. As you can see in the screen capture below, I have 'collapsed' queryInfo in order to be able to focus on the timeSeries object.
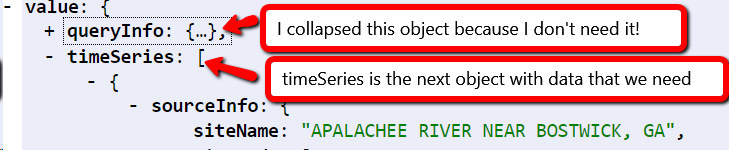
- As you can see in the collapsed view in the screen capture below, the timeSeries object contains an array with two objects. The first object has discharge data, the second has the gage height. Of course there is a ridiculous amount of additional information in those objects! FYI: the values object contains the data that we want.

- In the next screen capture (below) you can see how the values object leads to yet another array, which contains an object named value which leads to yet another array with another object inside that leads to a value named value which yields 283. Whew! At this point you may be too tired to paddle a kayak! As you can see this stuff gets pretty convoluted. The good news is that it's not all that difficult once you get the hang of it. BTW, the second object in the array referenced by the timeSeries object is structured identically to the first object, but it leads to gage height data. Once you get stream flow data, it's a simple thing to get gage height.

- Enough blather. Let's get down to the business of actually doing something with this data. To begin, download river.zip from https://apweb.quest/download/river.zip
- Put Brackets into split view. Open apalachee.html in one window and apalachee.js in the other. As you can see, apalachee.html is linked to apalachee.js and to another file named oconee.js. We'll get to the oconee part later. For now, focus on the two files named apalachee.
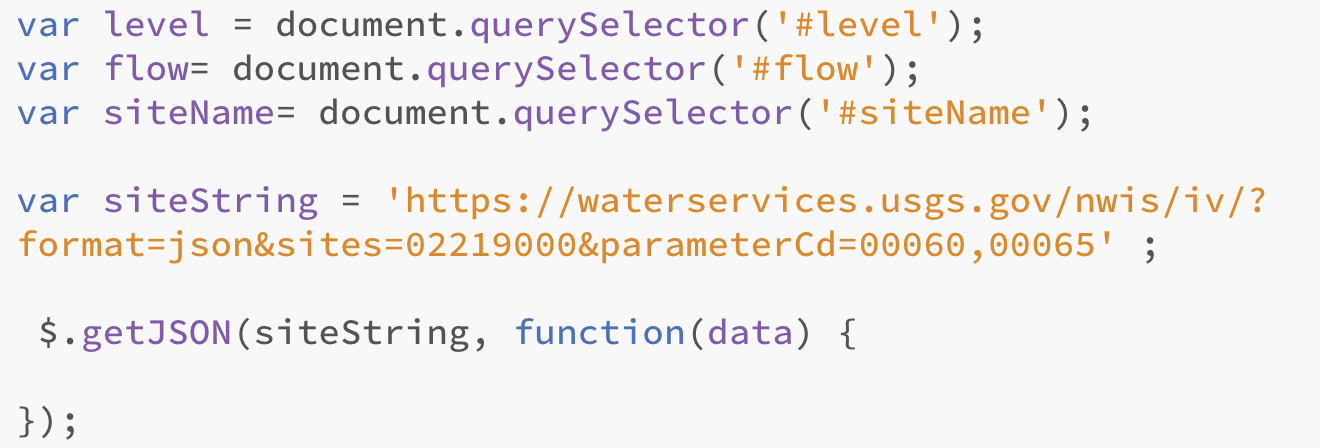
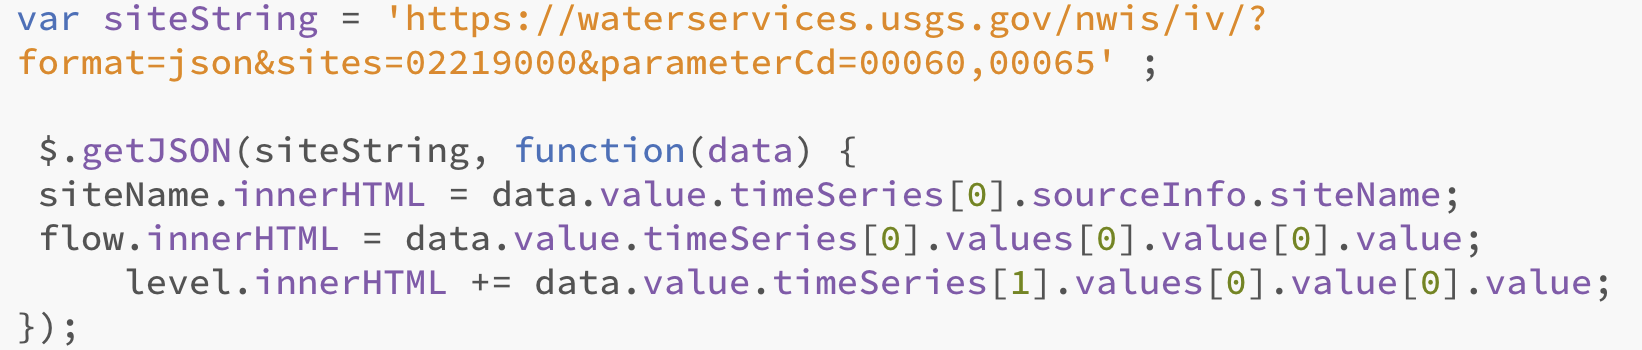
- As you can see, the html file contains an h1 and two h2 elements that contain span tags tied to ids. Those ids are already referenced in the js file. The js file also contains a variable named siteString which contains the same url that we looked at earlier for the Bostwick station on the Apalachee. Just below is a $.getJSON function that uses siteString to connect to the correct API.

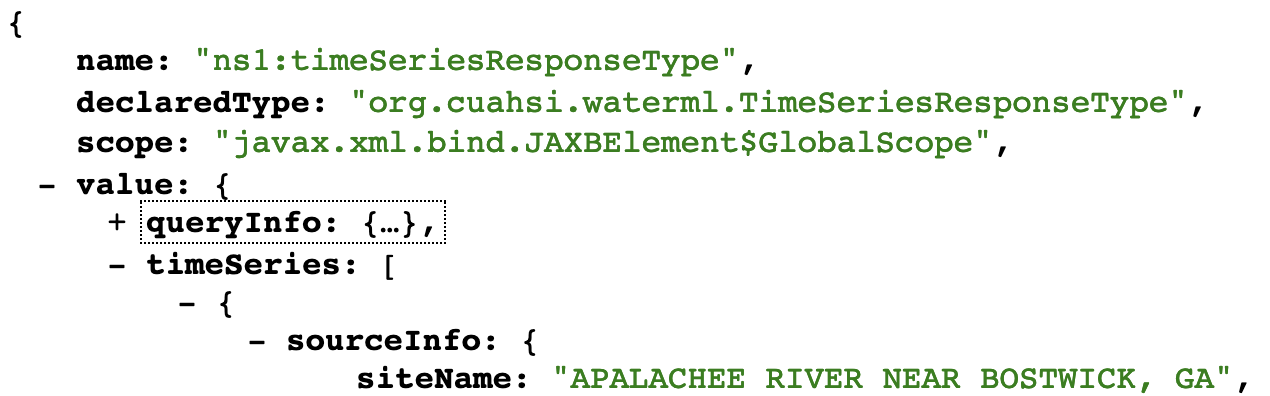
- For our first act we are going to get the name of the site. Visit the url that is referenced by siteString and take a look. Collapse the queryInfo object inside of the value object, so that your view looks similar to the one below. As you can see, the siteName is inside of an object referenced by sourceInfo, which is inside of yet another object that is the first item in an array referenced by timeSeries, which is inside of the value object. Is your head exploding yet? Let's get past all that angst.
- Start by addint siteName.innerHTML = data.value.timeSeries to the $.getJSON function. This will take you all the way down to the array which is referenced by timeSeries.
- Because we want the first item in that array, our next step is to tell that to our script with a [0], as in: siteName.innerHTML = data.value.timeSeries[0]
- The rest is just more dot syntax to get through sourceInfo to the siteName:
siteName.innerHTML = data.value.timeSeries[0].sourceInfo.siteName; - Test it out. If everything works properly you should see the words APALACHEE RIVER NEAR BOSTWICK, GA.
- Now let's get the discharge rate. As mentioned earlier, the value for discharge is located in the first item of the array referenced by timeSeries. Next it is referenced by the term 'values' which in turn references an array with just one object. Within that object is is the term 'value' which leads to yet another array that contains, as its first item, an object with the value that we want.

- This is hairy stuff, I know, but console.log provides a pretty good tool for finding your way to the data that you want. To illustrate, add console.log(data.value.timeSeries[0].values[0]); to the $.getJSON function. Then find your way to chrome's console to see the output. If you see something like the screen capture below, then you are on the right track. If you get an 'undefined' or an error message, you just went 'off-road.'

- Change the console.log statement to data.value.timeSeries[0].values[0].value[0] and, once again, look at your console output. This time you should see actual data. You are getting close! The final step is to use dot syntax to grab the actual value as in: data.value.timeSeries[0].values[0].value[0].value . At this point you should see an actual number that represents stream flow! All you have to do now is to tie that value to the flow variable as in:
flow.innerHTML = data.value.timeSeries[0].values[0].value[0].value; Now the correct value should appear on your page. - The final step is to tie level.innerHTML to the gage height value. The good news is that gage height is in the second item in the array referenced by timeSeries, but otherwise follows exactly the same path. So your job is to add
level.innerHTML = to something, to the $.getJSON function. Come on you can figure this one out. All you have to do is change one number.
Add lots of rivers!
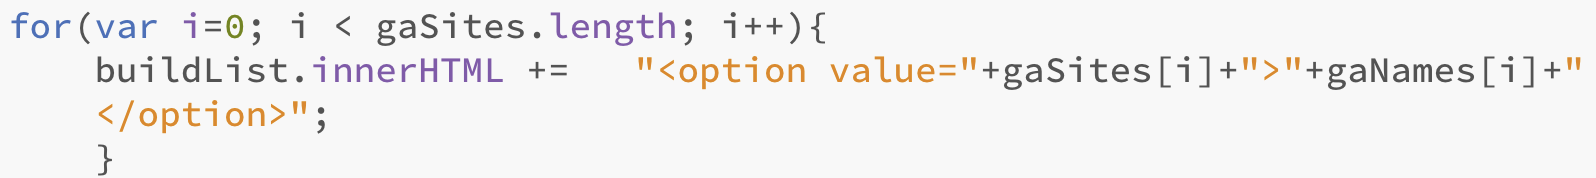
Now that we have done all the hard work of retrieving the data for one river, it's a relatively simple thing to retrieve data for many other rivers. All we need are the names and ids of those rivers, along with a couple of simple functions. Those names and ids are in oconeeData.js which is also attached to your html document. Take a look. You should see two arrays. gaSites contains the unique site number for each station on the Oconee and its tributaries. gaNames, as you may suspect, has the corresponding names.
- Our first step is to generate a dropdown list that we can use to select a river. Add the element shown below to your html, above everything else.

- Now add the line below next to your other querySelectors. We will use the buildList variable to do exactly what its name implies.

- As you can may have noticed, we reference a function named showSite which doesn't exist yet. We will get to that in a bit. For now, let's use a for loop to populate that list. Take a look at the screen capture below, which illustrates how to accomplish this task, which we have done in a previous exercise, btw. We are using the length of the gaSites array (in oconeeData.js) to control the length of our function. Afterward, we generate a series of option values and names from the gaSites and gaNames arrays. Give it a shot. Your webpage should now include a populated dropdown list.
- Now create the showSite function .
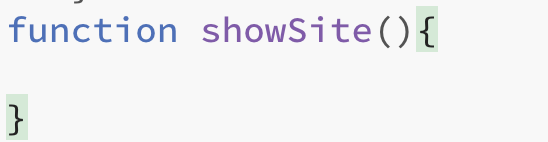
- Move everything shown below into the showSite function. As you can see, that includes the siteString variable and the $getJSON function.
- Add the line below to the showSite function, just above the siteString variable declaration. Whenever the showSite function is called from the dropdown list, this variable will capture the value of the site that you select.

-
There is just one little thing left to do: incorporate the whichSite variable into the siteString variable so that a new site appears whenever you select it. Simply replace sites=02219000 in the URL with the whichSite variable as shown below.

or look at this one in case you don't want to squint...

- Test it out. At this point you should be able to pick a river and see its data.
Take the Challenge: Link to a google map of the location.
The Task
- Each of the sourceInfo objects leads to the latitude and longitude of the selected station. You only need to use one of those objects and it does not matter which.
- These latitudinal and longitudinal values can be used to construct a url such as this one, http://www.google.com/maps/place/33.78817637,-83.4740513
that leads to the Bostwick station. - Your job is to get those values and incorporate them into a URL in your document that will change with each selection.
- When you click the URL it should take you to a web page that shows a google map of the location.
- You will, of course, need to incorporate the site name into the URL.
Challenge number 2. Find more data
USGS has a TON of taxpayer funded data about all sorts of things which you can read about at https://www.usgs.gov/products/data-and-tools/real-time-data . Your job now is to locate a JSON feed for one of those data sources, and figure out how you would access some of the data. USGS has LOTS of confusing information about how to go about this. Welcome to MY club. Have fun.