As you probably already know, when you create web applications with Javascript, you will make mistakes that have to be detected and overcome. Luckily, most modern browsers have built-in error detectors that many times can pinpoint the problem with your Javascript code. With Google Chrome a very useful error detection is built in and requires no special activation.
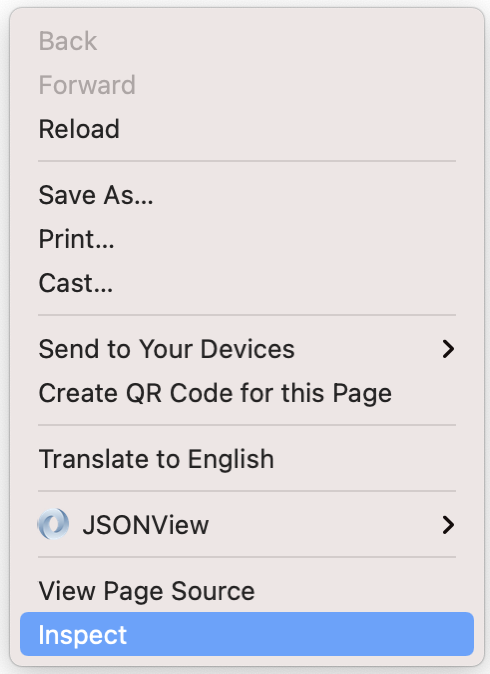
- When a Javascript enhanced webpage is not working as expected, simply right-click (or control click) on the page or a specific element on the page, and select inspect.
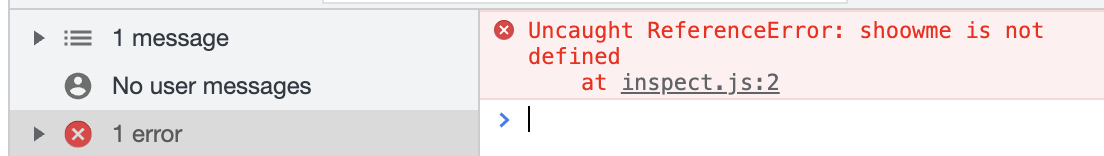
- The elements tab which shows the html of the page is the first thing activated, but locating a JS problem usually requires you to click the Console tab.

- As the screen capture below shows, my Console tells me that a Javascript file named inspect.js has an error on line two, where I am trying to invoke a variable named shoowme (with two o's) that is not defined.
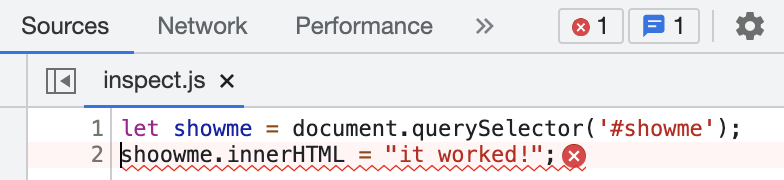
- When I click on the Sources tab or directly on inspect.js, I see that I carelessly misspelled the variable showme by adding an extra o to its name (shoowme instead of showme). At this point, all I have to do is revise my code, refresh the browser and my web app will work properly.
- That's all there is to it. The inspection tool is highly evolved, extremely useful, and should be the first resort whenever things are not working properly.